Tsunami Currents in Tauranga Harbor
This benchmark provides the data for comparison with a field database recording the Japan 2011 tsunami in Tauranga Harbor, New Zealand. The aim of this test is to attempt to include the effects of the tides. The model setup used is the one proposed in the benchmark description. A rotated domain of 40 km by 20 km with a 20 m numerical resolution was used (bathymetry data resolution 10 m), resulting in a 2,000,000 cell size problem. The boundary condition imposed at the “upper” boundary was the time series recorded at A Beacon for: 1) only tide, 2) only tsunami and 3) the combined tide+tsunami signals, depending on the simulated scenario.
The numerical results show a good agreement with measured data both for free surface elevation at the four tidal stations and for the three different configurations (tide only, tsunami only and tide plus tsunami signal). In Figure 4, measured vs simulated tsunami-only signal at the four tidal stations is shown (left column panel) and for tsunami+tide signal (right column panel). Finally, Figure 5 depicts the comparison between depth-average horizontal velocity data at ADCP location and simulated depth-average velocity, showing numerical results good agreement with observed data.

Figure 4. Comparison of the free surface elevation at the 4 tidal stations for tsunami-only signal and tsunami+tide signal.
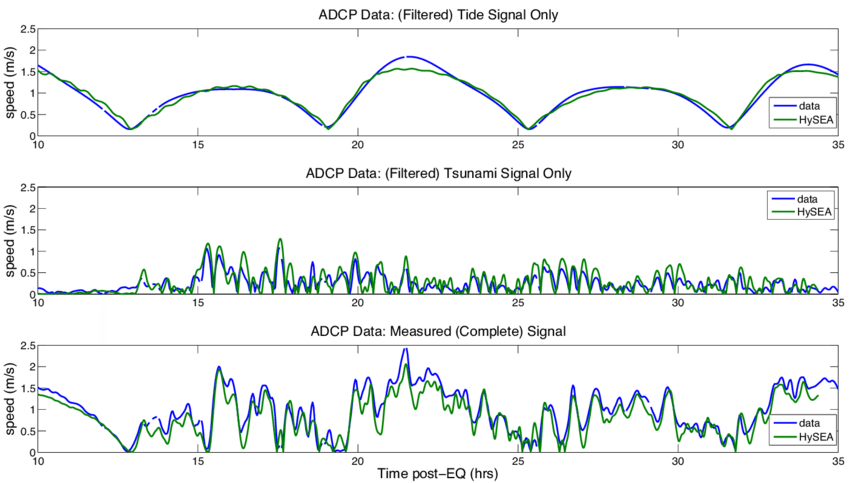
Figure 5. Depth average horizontal velocity comparison HySEA model-ADCP data.