Benchmark Description
The tsunami runup onto a complex three-dimensional model of the Monai Valley beach – laboratory
A laboratory experiment using a large-scale tank at the central Research Institute for Electric Power Industry in Abiko, Japan, was focused on modeling runup of a long wave on a complex beach near the village of Monai (Liu et al., 2008). The beach in the laboratory wave tank was a 1:400 scale model of the bathymetry and topography around a very narrow gully, where extreme runup was measured. More information regarding this benchmark can be found in Synolakis et al. (2008).
Problem setup
The main items describing the numerical setup of this problem are:
- Friction. Manning coefficient is set to 0.03
- Computational Domain. [0,5.488] x [0,3.402] (units in meters).
- Boundary conditions. The given initial wave was used to specify the boundary condition at the left boundary up to time t=22.5 s. After time t=22.5 s non-reflective boundary conditions. Solid wall boundary conditions were used at the top and bottom boundaries.
- Initial condition. Water at rest.
- Grid resolution. A 393 x 244 size mesh was used, with the same resolution (0.014 m) as the bathymetry. Table BP7.1 collects grid information.
- Time stepping. Variable time stepping based on a CFL condition.
- CFL. 0.9
- Model used. Tsunami-HySEA WAF

Table BP7.1. Mesh information showing grid resolution, number of cells and computing time needed for a 200 s simulation.
Tasks to be performed
- Model propagation of the incident and reflective wave according to the benchmark specified boundary condition,
- Compare the numerical and laboratory measured water level dynamics at gauges 5, 7, and 9,
- Show snapshots of the numerically computed water level at time synchronous with those of the video frames; it is recommended that each modeler find times of the snapshots that best fit the data,
- Compute maximum runup in the narrow valley.
Tasks to be performed
Task 1 Gauge comparison
Figure BP7.1 shows a comparison of Tsunami-HySEA results with the laboratory values for the three requested gauges from t=0 to t=30 s. Superimposed is the Normalized Root Mean Square Deviation (NRMSD). A mean value of 7.66% for the NRMSD is obtained for the all three gauges for the time series simulating the first 30 seconds. Figure BP7.2 depicts the simulated water elevations at the three gauges with the four resolutions considered in the time interval [0,60]. For all resolutions comparable results are obtained, above all in the first main wave.
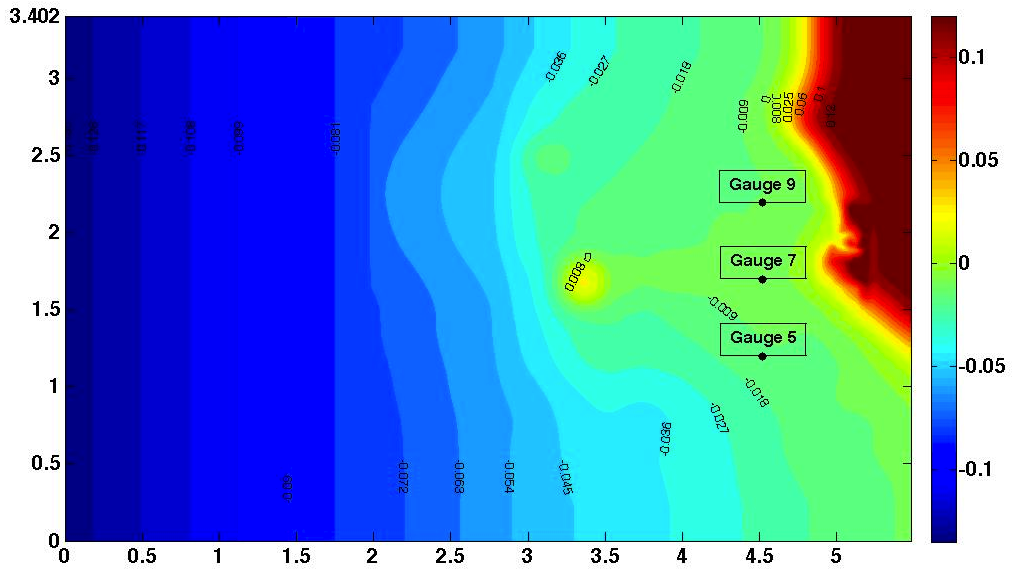
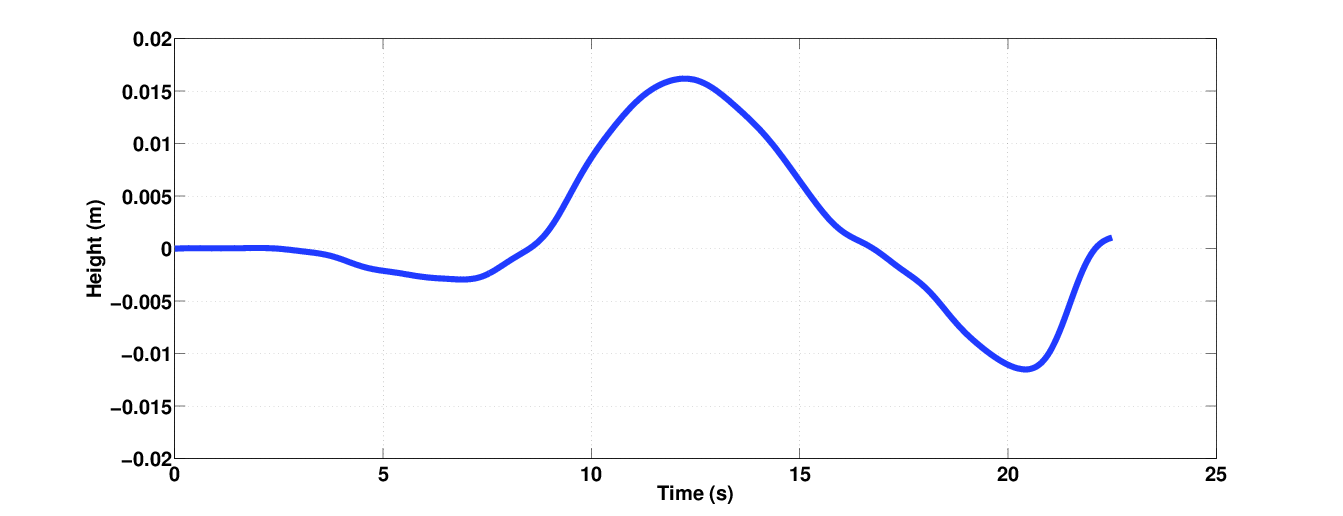

Figure BP7.1. Comparison experimental and simulated water level at gauges 5, 7, and 9 from t=0 to t=30 s.
Tasks to be performed
Task 2 Frame comparisons
Figure BP7.3 (split in three pages) shows comparisons of the Frames 10, 25, 40, 55, and 70 from the overhead movie with Tsunami-HySEA numerical simulation at corresponding times, t=15, 15.5, 16, 16.5, and 17 in s. These results are from the 393 x 244 grid (the coarser grid that coincides with bathymetry data resolution).
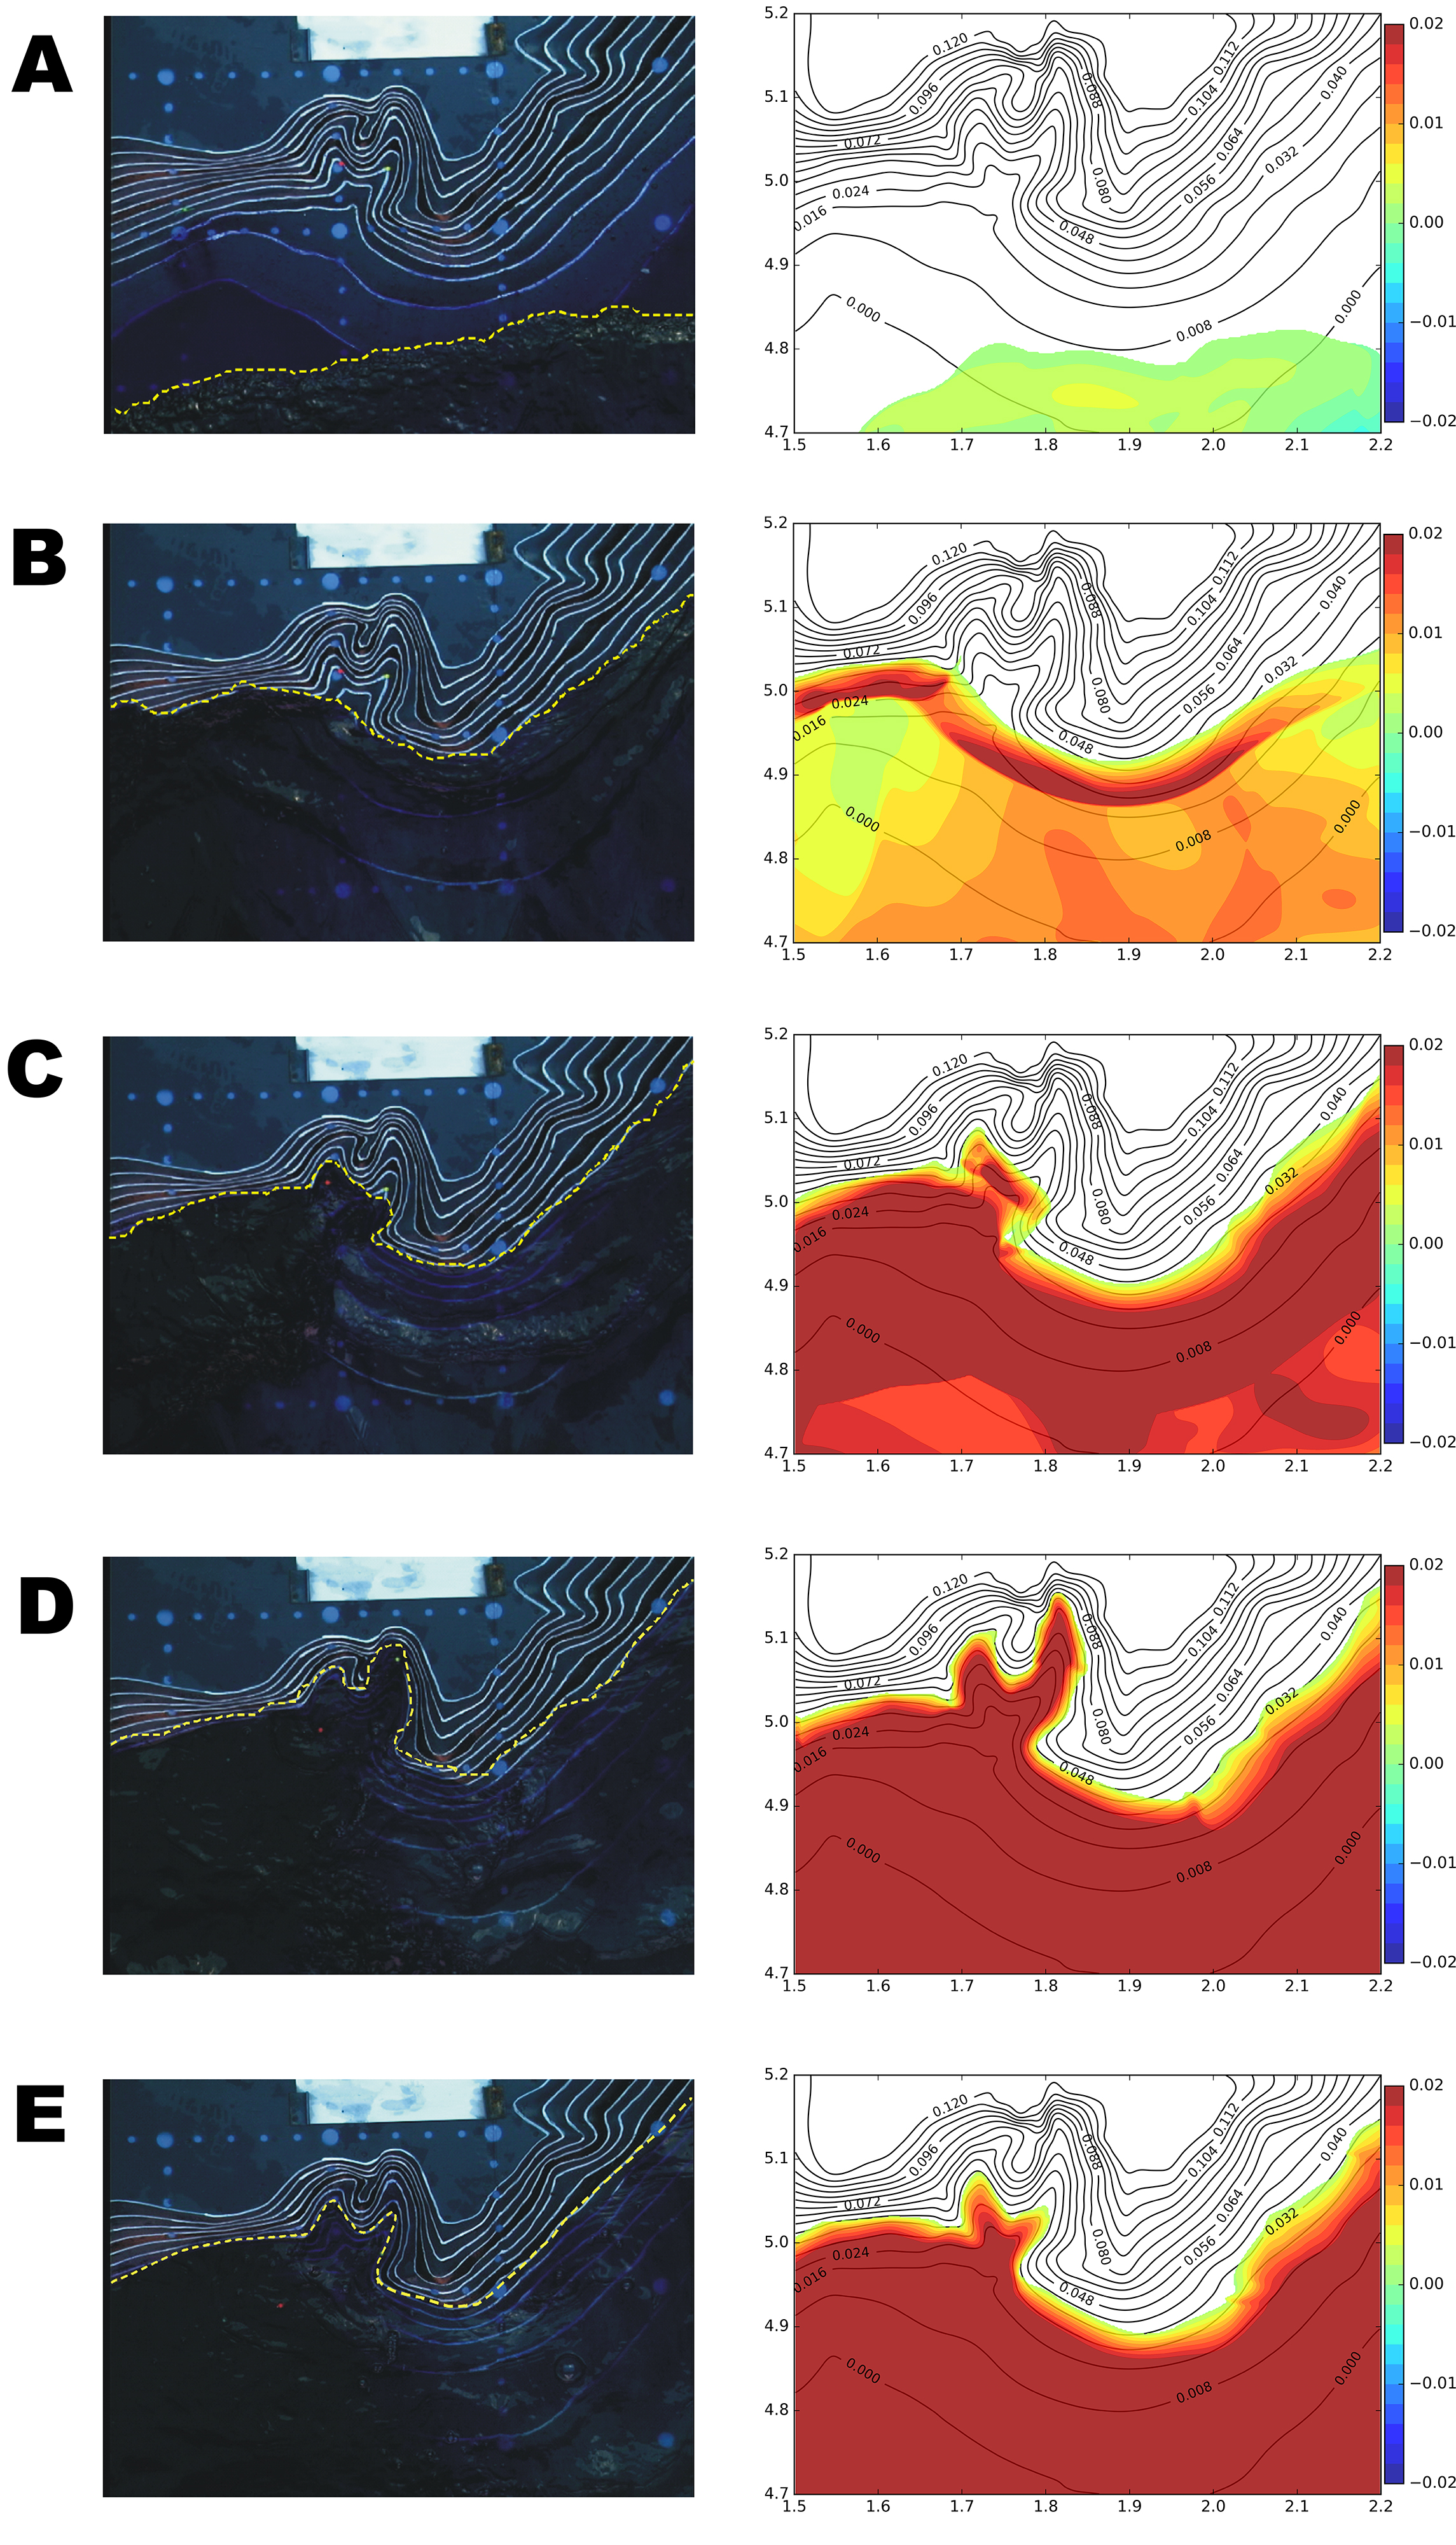
Figure BP7.3. Comparison of snapshots of the laboratory experiment with the numerical simulation. (A)
Frame 10 – Time 15 s, (B)
Frame 25 – Time 15.5 s, (C)
Frame 40 – Time 16 s, (D)
Frame 55 – Time 16.5 s, (E)
Frame 70 – Time 17 s.
Tasks to be performed
Task 3 Runup in the valley
A maximum simulated runup height of 0.0891 (compared with the 0.08958 experimentally measured) is reached at time t=16.3 s at point (5.1559,1.8896). Figure BP7.4 (in two panels, the second for a zoom) shows the frame corresponding to time t=16.3 seconds, where the computed maximum runup location is marked with a red dot.
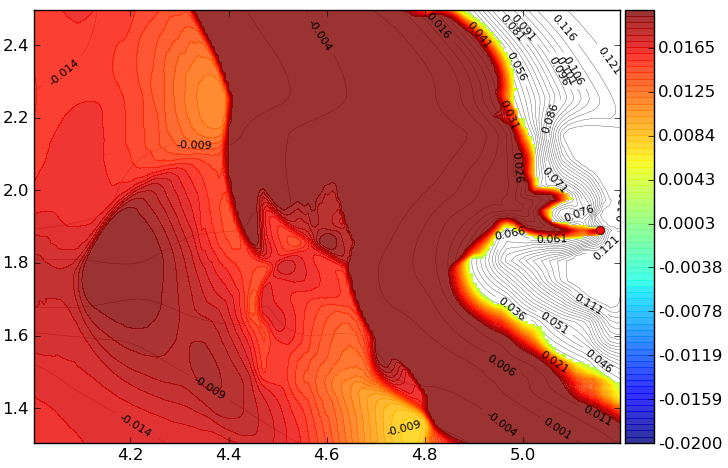
Figure BP7.4. Maximum simulated runup, reached at time t=16.3 s, at point (5.15592,1.88961), reaching a maximum height of 0.0891 (versus the 0.08958 experimentally measured). Lower panel for a zoom.